Microsoft introduced a new feature called Viewership retention chart for Stream videos stored in OneDrive & SharePoint. It helps Stream content creators to better understand their audience and provide relevant information.
This update is part of Roadmap item to help improve viewership retention and to see which parts of video is watched. https://www.microsoft.com/en-ww/microsoft-365/roadmap?filters=&searchterms=85643
By the time of this writing it is released to GA. (December 2021)
This feature is available only for Stream videos stored in OneDrive & SharePoint. Not available for Classic stream videos.
Peak Viewership
You video might include an important announcement or update in the middle or towards the end. Viewership might be high as viewers might directly jump to that section or replay it multiple times skipping the intro. Viewership retention chart tracks rewatching. Meaning in a single session (view) if a viewers jumps back to a point in video to rewatch it, it is captured and it reflects in the chart. If more viewers jump a section of video or replays a part, it will be detected in peak viewership metric.
Another point to note is, viewership retention is different to total number of views and unique views statistics we already get. In a single view, user can jump back and forth contributing to peak viewership point. This metric will be reset if a video is edited and a new version is created.
How to access Viewership retention chart
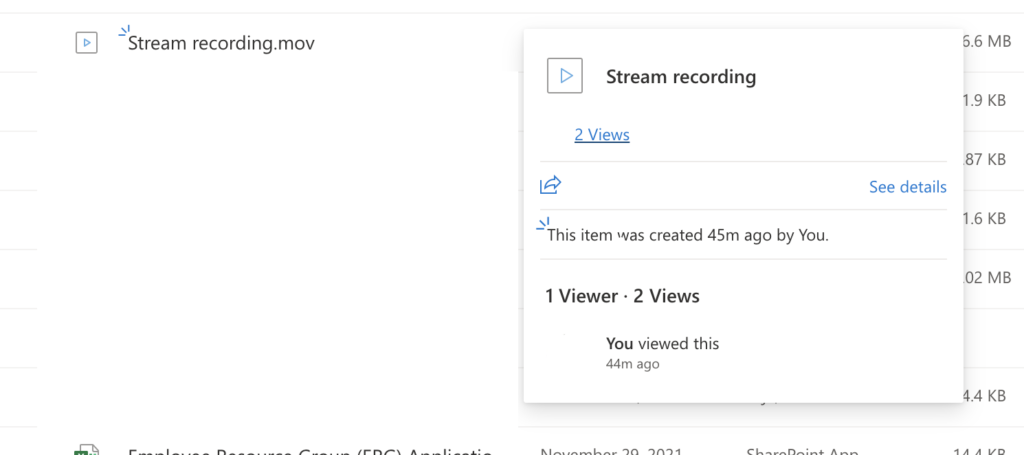
- In SharePoint or OneDrive, hover over your video file to view file card. It includes a metric call views. Click on it to access viewership retention chart.
- You can also open file details pane, to access views and viewership retention chart.
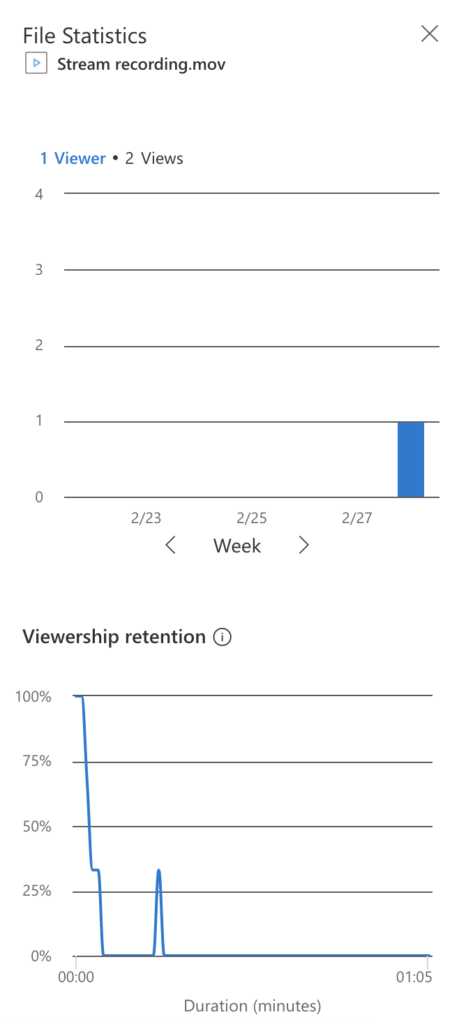
Useful insights can be derived from this chart which is available out of the box.
Example in my images has only 1 viewer and 2 views, as video garners more views, it will provide useful insights. Idea of this post is to highlight this feature.